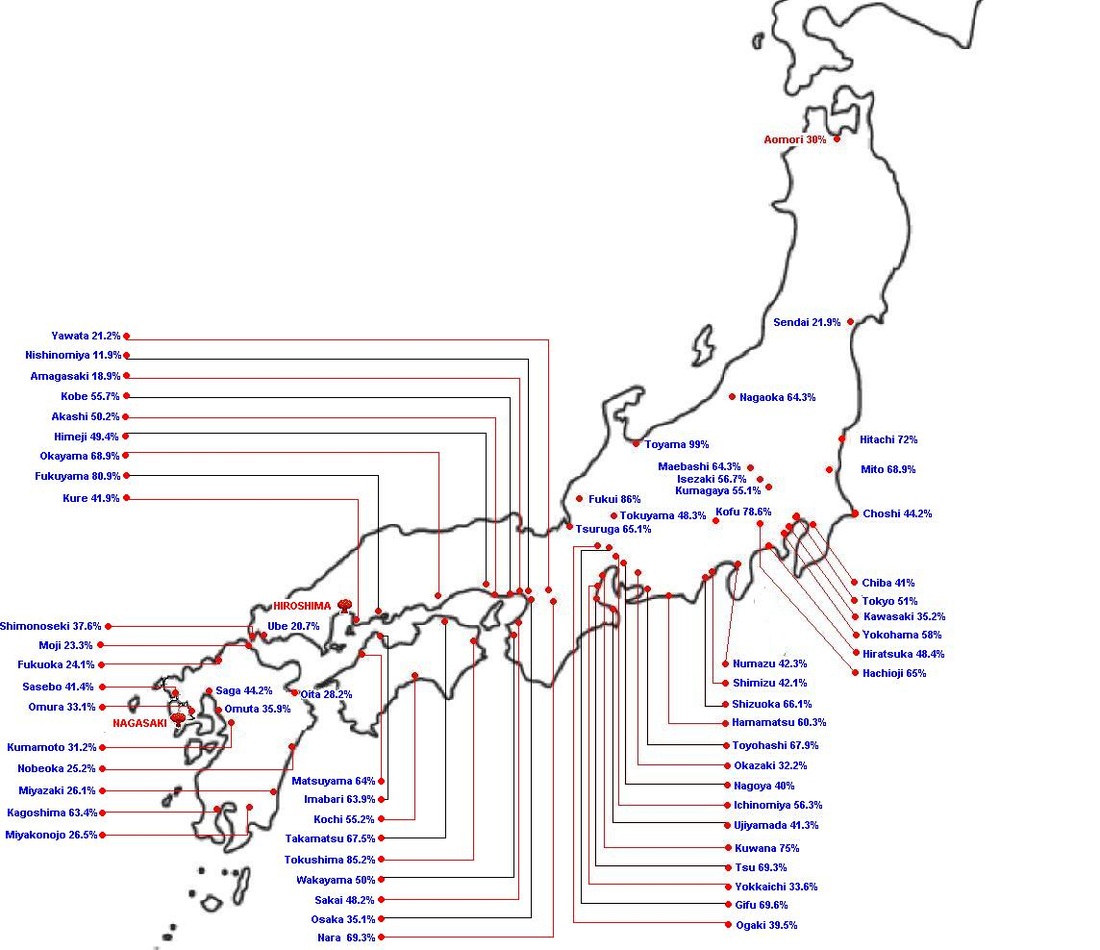
about the above map
This map shows the destruction by percentages of Japanese cities as a result of the bombing campaigns of World War II. As you may be able to tell, NAGASAKI and HIROSHIMA are in bold, red, all caps font on the map, apparently because those factors relate how severe the atomic bombs were in comparison to the other bombed cities... As you can see, there are well over 50 cities where more than a quarter of the city was destroyed, and many of these cities were industrial cities. In fact, US General Curtis LeMay even stated that the US would run out of industrial targets in which they could bomb; this was a factor that contributed to the usage of the atomic bombs.
Hiroshima damage map

This is a map of the blast radius and some of the damage of the Hiroshima bomb and the fires that followed.The red on this map depicts the limits of the blast damage of the Hiroshima bomb, or the, more or less, initial blast radius. It is depicted as the "extent of fire." The varying shades of grey (50 shades?) demonstrate the varying levels of fire damage.
